-- PedroRio - 24 Mar 2010


Gráficos XVW: Barras, Linhas e em Tarte
A componente de gráficos XVW permite a criação de Gráficos de Barras (Horizontais e Verticais) com múltiplas séries, assim como gráficos de linhas (com múltiplas séries) e gráficos em tarte. Todos os componentes de gráficos precisam de um "Data Set" que representa os valores a apresentar nos respectivos gráficos, os data sets são preenchidos através de métodos da Bean utilizada no Viewer. Todos os tipos de gráficos tem dois tipos de render diferentes, uma em Flash e outra em Imagem estática, que podem ser escolhidos na declaração XML do gráfico.Gráfico em Tarte (Pie Chart)
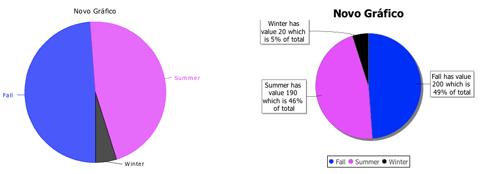
O gráfico em tarte permite criar uma visualização em forma de tarte (daí o nome) para um conjunto de pares chave/valor. O total dos valores somados corresponde a 100% e cada valor correspondente à chave representa uma percentagem desse total.
Declaração XML de Pie Chart
Em baixo fica uma declaração completa com todas as opções do Pie Chart (de notar que se assume a existência de uma Bean associada ao viewer com o identificador "viewBean".<xvw:pieChart
label="Gráfico Exemplo"
dataSet="#{viewBean.dataSet}"
width="500"
height="300"
type="IMG"
configOptions="#{viewBean.configOptions}"
>
</xvw:pieChart>
Os elementos, label, width e height podem ter os valores a partir da Bean do viewer, como tal é possível algo como:
<xvw:pieChart
    label="#{viewBean.label}"
    dataSet="#{viewBean.dataSet}"
    width="#{viewBean.width}"
    height="#{viewBean.height}"
    type="IMG"
    configOptions="#{viewBean.configOptions}"
    >
</xvw:pieChart>
Propriedades do Pie Chart
| Nome da Propriedade | Descrição | Tipo | Valores Possíveis | Valor por omissão | Uso |
|---|---|---|---|---|---|
| label | Um texto para mostrar gráfico como legenda | String | Qualquer String | Nenhum | Obrigatório |
| dataSet | Fonte de dados para o gráfico, essencialmente um conjunto de pares chave/valor | Interface Java | Uma implementação da interface Java | Nenhum | Obrigatório |
| width | O comprimento do gráfico (em pixeis) | Integer | Qualquer valor maior que zero | 400 | Opcional |
| height | A altura do gráfico (em pixeis) | Integer | Qualquer valor maior que zero | 300 | Opcional |
| type | O tipo de render do gráfico, se imagem estática ou em flash | String | IMG, FLASH | Nenhum | Obrigatório |
| configOptions | Configurações da formatação do gráfico | Interface Java | Uma implementação da interface Java | Nenhum | Opcional |
Interface Java da Fonte de Dados (Pie Data Set)
Os dados necessários para um Pie Chart são um conjunto de pares chave-valor. O método que se colocar na configuração XML para a propriedade "dataSet" TEM de devolver uma implementação desta interface para que o gráfico possa ser construído./**
* Retrieves a value, given a key
*
* @param key The key corresponding to the value
*
* @return A number representing the value
*/
public Number getValue(Comparable<String> key);
/**
*
* Retrieve the list of categories in the pie chart
*
* @return A list of categories
*/
public List<String> getCategories();
/**
*
* The label for the category
*
* @return A string with the label for the key set
*/
public String getCategoryLabel();
/**
*
* The label for the value set
*
* @return A string with the label for the value set
*/
public String getValueLabel();
Interface Java das Configurações (IPieChartConfiguration)
Os gráficos em tarte estão configurados para terem determinado aspecto por omissão. Esse aspecto pode ser customizado se se fizer a implementação da interface IPieChartConfiguration, que possui métodos para alterar o aspecto de alguns componentes do gráfico. A definição da Interface é a seguinte:/**
*
* Returns the background color of the chart
*
* @return The Color to use or null if the default colour should be used
*/
public Color getBackgroundColour();
/**
*
* The list of colours for the pie pieces
*
* @return A mapping of the pie piece name to the colour it should have
*/
public HashMap<String,Color> getColours();
/**
*
* Whether or not the pie chart should show the labels
*
* @return True if the labels should be shown and false otherwise
*/
public boolean showLabels();
/**
*
* Whether or not the pie chart title should be shown
*
* @return True if the chart should display the title and false otherwise
*/
public boolean showChartTitle();
/**
*
* Returns the string expression to use as tooltip, one can use the following
* special variables
*
* $key = The name of the pie slice
* $val = The value of the slice
* $percent = the percentage from total of the slice
*
* Example: "$key has value $val which is $percent of total",
* which could output something like
* "Microsoft has value 30000 which is 30% of total"
*
* @return A string expression for the tooltip (or null to use the default value)
*/
public String getTooltipString();
Implementação Exemplo
A titulo exemplificativo, a página da Implementação Exemplo tem o código completo de uma Bean e uma implementação da interface de dados e da interface de configurações e imagens de como a situação é alterada consoante as configurações.Gráfico de Barras (Bar Chart)
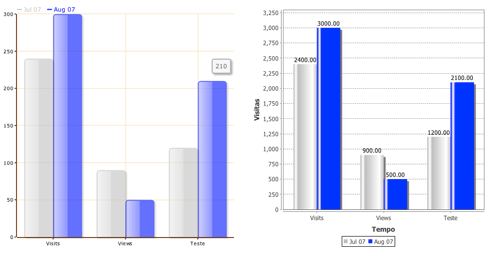
O gráfico de barras permite uma visualização de pontos sobre dois eixos (X,Y). Os gráficos de barras podem ser apresentados na vertical ou horizontal e podem conter múltiplas séries.
Declaração XML de um Bar Chart
<xvw:barChart
        dataSet="#{viewBean.barDataSet}"
        label="My Bar Chart"
        width="1000"
        height="400"
        type="FLASH"
        orientation="vertical"
        configOptions="#{viewBean.configBarOptions}"
        >
</xvw:barChart>
Tal e qual como no Pie Chart, as propriedades label, width e height podem ser alimentadas a partir da Bean do Viewer.
Propriedades do Bar Chart
| Nome da Propriedade | Descrição | Tipo | Valores Possíveis | Valor por omissão | Uso |
|---|---|---|---|---|---|
| label | Um texto para mostrar gráfico como legenda | String | Qualquer String | Nenhum | Obrigatório |
| dataSet | Fonte de dados para o gráfico, essencialmente um conjunto de pares chave/valor | Interface Java | Uma implementação da interface Java | Nenhum | Obrigatório |
| width | O comprimento do gráfico (em pixeis) | Integer | Qualquer valor maior que zero | 400 | Opcional |
| height | A altura do gráfico (em pixeis) | Integer | Qualquer valor maior que zero | 300 | Opcional |
| type | O tipo de render do gráfico, se imagem estática ou em flash | String | IMG, FLASH | Nenhum | Obrigatório |
| orientation | A orientação do gráfico. "vertical" para vertical e "horizontal" para horizontal | String | vertical, horizontal | horizontal | Opcional |
| configOptions | Configurações da formatação do gráfico | Interface Java | Uma implementação da interface Java | Nenhum | Opcional |
Interface Java para os dados (Series Data Set)
/**
 *
 * Represents a data set which can have a set of columns (xAxis) and for each value in the xAxis, a set
 * of series (yAxis) can exist. This interface represents the data set for bar/line charts. For instance if a bar chart showing
 * page views and visits to given website over the course of a three months (January to March), the DataSet would have
 * three columns (January, February and March) and two series (page views and visits), with a value for page view and visit for
 * each of the three months
 *
 *
 *
 */
public interface SeriesDataSet
{

    /**
     *
     * Retrieves the list of series of this data set (must be at least one)
     *
     * @return The list of series
     */
    public List<String> getSeriesKeys();

    /**
     *
     * Retrieves the list of columns of this data set (must be at least one)
     *
     * @return The list of columns of this data set
     */
    public List<String> getColumnKeys();

    /**
     *
     * For a given Column and a given series, retrieves the value associated
     *
     * @param seriesKey The series key
     * @param columnKey The column key
     *
     * @return The numeric value associated with the series/column pair, or null if there's no value
     * for that specific pair
     */
    public Number getValue(String seriesKey, String columnKey);


    /**
     *
     * The name of the XAxis values
     *
     * @return The name of the XAxis values
     */
    public String getXAxisLabel();


    /**
     *
     * The name of the YAxis values
     *
     * @return The name of the YAxis values
     */
    public String getYAxisLabel();

}
Tal como introduzido anteriormente,
Interface Java de Configurações (IBarCharConfiguration)
/**
     *
     * Returns the background color of the chart as Java Color
     *
     * @return A Color instance with the required color
     */
    public Color getBackgroundColour();

    /**
     *
     * The list of colours for the series of the chart
     *
     * @return A mapping of the series name to the colour it should have
     */
    public HashMap<String,Color> getColours();

    /**
     *
     * Whether or not the pie chart title should be shown
     *
     * @return True if the chart should display the title and false otherwise
     */
    public boolean showChartTitle();

    /**
     *
     * Returns the string expression to use as tooltip, one can use the following
     * special variables
     *
     * $val = The value for the point
     *
     * @return A string expression for the tooltip (or null to use the default value)
     */
    public String getTooltipString();
aaaa
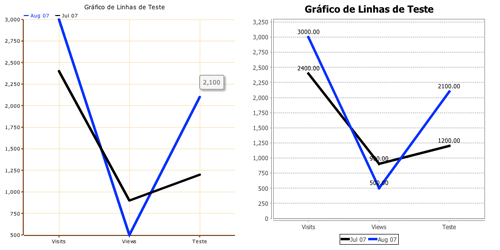
Gráfico de Linhas (Line Chart)
Gráficos de linhas são gráficos em que os pontos (pares X,Y) estão unidos por uma linha, sendo que no mesmo gráfico podem-se ter várias linhas representados dados diferentes. É um tipo de gráfico que partilha o mesmo tipo de dados do gráfico de Barras.
Definição XML (Line Chart)
<xvw:lineChart
    dataSet="#{viewBean.lineDataSet}"
    label="Sample Line Chart"
    width="500"
    height="500"
    type="FLASH"
    configOptions="#{viewBean.configLineOptions}"
/>
As propriedades label, width e height podem ser provenientes da Bean do viewer como tal podemos ter o seguinte:
<xvw:lineChart
    dataSet="#{viewBean.lineDataSet}"
    label="#{viewBean.label}"
    width="#{viewBean.width}"
    height="#{viewBean.height}"
    type="FLASH"
    configOptions="#{viewBean.configLineOptions}"
/>
Propriedades de um Line Chart
| Nome da Propriedade | Descrição | Tipo | Valores Possíveis | Valor por omissão | Uso |
|---|---|---|---|---|---|
| label | Um texto para mostrar gráfico como legenda | String | Qualquer String | Nenhum | Obrigatório |
| dataSet | Fonte de dados para o gráfico, essencialmente um conjunto de pares chave/valor | Interface Java | Uma implementação da interface Java | Nenhum | Obrigatório |
| width | O comprimento do gráfico (em pixeis) | Integer | Qualquer valor maior que zero | 400 | Opcional |
| height | A altura do gráfico (em pixeis) | Integer | Qualquer valor maior que zero | 300 | Opcional |
| type | O tipo de render do gráfico, se imagem estática ou em flash | String | IMG, FLASH | Nenhum | Obrigatório |
| configOptions | Configurações da formatação do gráfico | Interface Java | Uma implementação da interface Java | Nenhum | Opcional |
Interface Java de Dados (Series Data Set)
A interface de dados de um Line Chart é exactamente a mesma de um Bar Chart, como tal é consultar a Series Data Set dos Bar Chart.Interface Java de Configurações para um Line Chart
public interface ILineChartConfiguration
{

    /**
     *
     * Returns the background color of the chart as Java Color
     *
     * @return A Color instance with the required color (or null to retain the default color)
     */
    public Color getBackgroundColour();

    /**
     *
     * The list of colours for the series of the chart
     *
     * @return A mapping of the series name to the colour it should have
     */
    public HashMap<String,Color> getColours();

    /**
     *
     * Whether or not the pie chart title should be shown
     *
     * @return True if the chart should display the title and false otherwise
     */
    public boolean showChartTitle();

    /**
     *
     * Returns the string expression to use as tooltip, one can use the following
     * special variables
     *
     * $val = The value for the point
     *
     * @return A string expression for the tooltip (or null to use the default value)
     */
    public String getTooltipString();

    /**
     *
     * Retrieves the stroke size for the lines
     *
     * @return An integer with the stroke size (in pixels) for each line or 0 to use the default size
     */
    public int getStrokeSize();


} 

| I | Attachment | Action | Size | Date | Who | Comment |
|---|---|---|---|---|---|---|
| |
BarChart.png | manage | 9.4 K | 2010-03-29 - 09:26 | PedroRio | Bar Charts |
| |
LineChart.png | manage | 14.4 K | 2010-03-29 - 09:36 | PedroRio | Line Chart |
| |
PieChart.png | manage | 8.9 K | 2010-03-26 - 18:24 | PedroRio | Pie Chart |
XEO Primer
- - Instalation
- - Introduction
- - Concepts
- - Architecture
- - XEO Library
- - Deploy to EAR
- - PreferenceStore
- - XEO Model Reference
- - Security
- - Java API
- - BOL
- - XEOQL (BOQL)
- - Administrating
- - Background Tasks
- - boConfig.xml
- - Web.xml
- - Known Issues
- - XEO Flags
- - Web Components
- - Java Samples
- - Custom Components
- - Component Plugins
- - Internationalization
- - Viewer Events
- - Value Change Listeners
- - XUIServlet
- - XeoLocalization
- - XvwTemplates
No permission to view TWiki.WebTopBar