

| I | Attachment | Action | Size | Date | Who | Comment |
|---|---|---|---|---|---|---|
| |
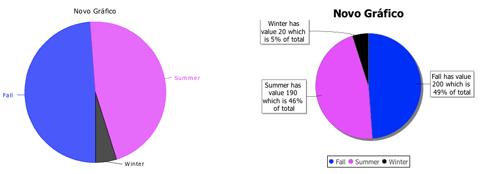
PieChart.png | manage | 8.9 K | 2010-03-26 - 18:24 | PedroRio | Pie Chart |
XEO Primer
- - Instalation
- - Introduction
- - Concepts
- - Architecture
- - XEO Library
- - Deploy to EAR
- - PreferenceStore
- - XEO Model Reference
- - Security
- - Java API
- - BOL
- - XEOQL (BOQL)
- - Administrating
- - Background Tasks
- - boConfig.xml
- - Web.xml
- - Known Issues
- - XEO Flags
- - Web Components
- - Java Samples
- - Custom Components
- - Component Plugins
- - Internationalization
- - Viewer Events
- - Value Change Listeners
- - XUIServlet
- - XeoLocalization
- - XvwTemplates
No permission to view TWiki.WebTopBar